

phpstudy和IDEA 配置php debug
分类:大杂烩
时间:2024-04-25 23:13
浏览:0
评论:0
1.安装xdebug 扩展,phpinfo() 查看
2.配置php.ini
zend_extension=D:/phpstudy_pro/Extensions/php/php7.4.3nts/ext/php_xdebug.dll
xdebug.collect_params=1
xdebug.collect_return=1
xdebug.auto_trace=On
xdebug.trace_output_dir=D:/phpstudy_pro/Extensions/php_log/php7.4.3nts.xdebug.trace
xdebug.profiler_enable=On
xdebug.profiler_output_dir="D:\phpstudy_pro\Extensions\tmp\xdebug"
xdebug.remote_enable=On
xdebug.idekey=PHPSTORM
xdebug.remote_autostart=On
xdebug.remote_host=localhost
xdebug.remote_port=9003
xdebug.remote_handler=dbgp
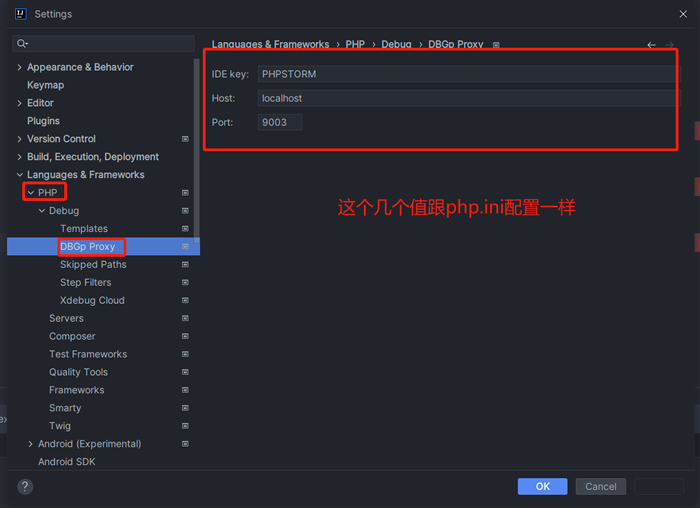
注意xdebug.idekey和xdebug.remote_port 要和稍后的IDEA一致。
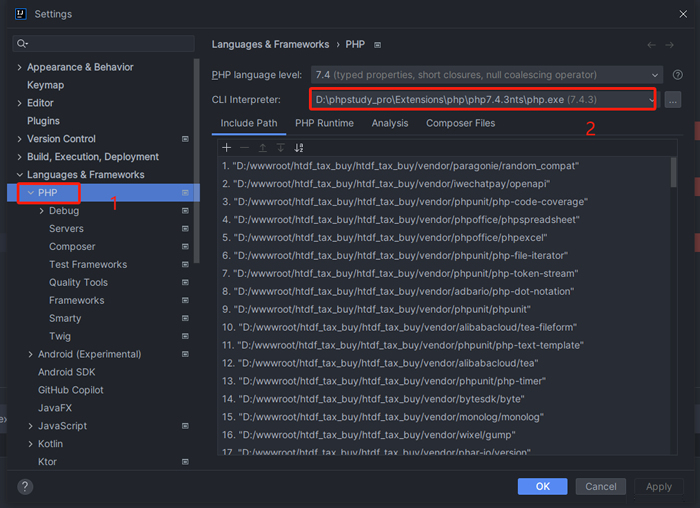
3.配置php可执行路径
4.配置代理
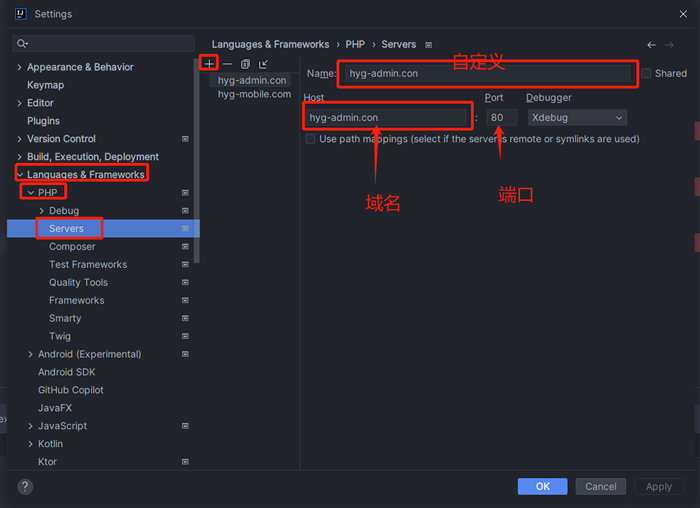
5.配置主机、域名
6.点击apply后,重启IDEA。
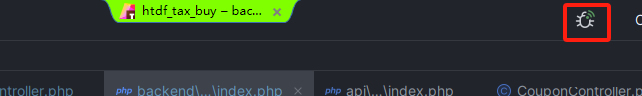
7.打开
8.在显示代码行数上打断点

9.在浏览器上请求到打断点的方法,即可触发debug
10.配置的Servers,在phpstorm中应该是在当前项目配置的,项目删除后需要重新配置。
注意:配置的Servers->Hosts 不能带http(s)或者/斜杆。
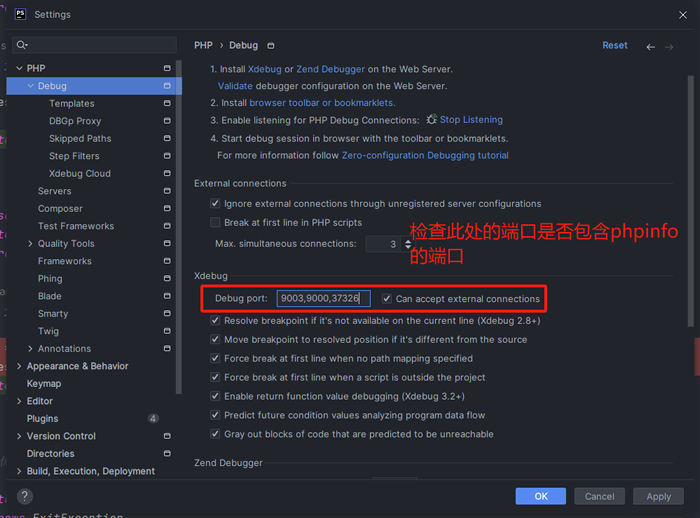
11.检查端口
12.各种配置完后,重启一下生效。
2.配置php.ini
zend_extension=D:/phpstudy_pro/Extensions/php/php7.4.3nts/ext/php_xdebug.dll
xdebug.collect_params=1
xdebug.collect_return=1
xdebug.auto_trace=On
xdebug.trace_output_dir=D:/phpstudy_pro/Extensions/php_log/php7.4.3nts.xdebug.trace
xdebug.profiler_enable=On
xdebug.profiler_output_dir="D:\phpstudy_pro\Extensions\tmp\xdebug"
xdebug.remote_enable=On
xdebug.idekey=PHPSTORM
xdebug.remote_autostart=On
xdebug.remote_host=localhost
xdebug.remote_port=9003
xdebug.remote_handler=dbgp
注意xdebug.idekey和xdebug.remote_port 要和稍后的IDEA一致。
3.配置php可执行路径
4.配置代理
5.配置主机、域名
6.点击apply后,重启IDEA。
7.打开
8.在显示代码行数上打断点
9.在浏览器上请求到打断点的方法,即可触发debug
10.配置的Servers,在phpstorm中应该是在当前项目配置的,项目删除后需要重新配置。
注意:配置的Servers->Hosts 不能带http(s)或者/斜杆。
11.检查端口
12.各种配置完后,重启一下生效。
1. 本站所有资源来源于用户上传或网络,仅作为参考研究使用,如有侵权请邮件联系站长!
2. 本站积分货币获取途径以及用途的解读,想在本站混的好,请务必认真阅读!
3. 本站强烈打击盗版/破解等有损他人权益和违法作为,请各位会员支持正版!
4. 大杂烩 > phpstudy和IDEA 配置php debug
2. 本站积分货币获取途径以及用途的解读,想在本站混的好,请务必认真阅读!
3. 本站强烈打击盗版/破解等有损他人权益和违法作为,请各位会员支持正版!
4. 大杂烩 > phpstudy和IDEA 配置php debug
